Experimental - Untargeted Lipid Analysis
Typical untargeted lipid analysis report as of July 2026.
Sample Preparation
Lipid samples extracted using 2-phase or a Wessel-Flügge extraction. Extracted analysts are dried and reconstituted in 40 µL 65:30:5 (isopropanol:acetonitril:water) containing 1:50 (v/v) of 69 deuterated lipids (UltimateSPLASH™ ONE, Avanti) internal standard (ISTD). Following vortex and centrifugation at ~12k RPM/~18k RCF, 35 µL of each sample is transferred to HPLC glass vials (p/n 186000385c, Waters) and the remaining 5 uL is used to generate a pool sample. Sample injection order is randomized prior to analysis by LC-MS/MS. All solvents are LCMS grade (Optima, Thermo).
Lipid samples extracted using 2-phase or a Wessel-Flügge extraction. Extracted analysts are dried and reconstituted in 40 µL 65:30:5 (isopropanol:acetonitril:water) containing 1:50 (v/v) of 69 deuterated lipids (UltimateSPLASH™ ONE, Avanti) internal standard (ISTD). Following vortex and centrifugation at ~12k RPM/~18k RCF, 35 µL of each sample is transferred to HPLC glass vials (p/n 186000385c, Waters) and the remaining 5 uL is used to generate a pool sample. Sample injection order is randomized prior to analysis by LC-MS/MS. All solvents are LCMS grade (Optima, Thermo).
Data acquisition
Typically 2 µL sample, maintained at 4°C, is injected by a UHPLC system (Vanquish Duo, Thermo) and separated by reversed phase chromatography (Ascentis Express 90 Å C18, 2.7 μm, 15 cm × 4.6 mm, Thermo). The column is heated to 55 °C and the gradient, composed of mobile phase A (10 mM ammonium formate in 60:40 water:acetonitrile in 0.1% formic acid) and mobile phase B (10 mM ammonium formate in 88:10:2 isopropanol:acetonitrile:water in 0.1% formic acid), is delivered at 260 µl/min. All solvents are LCMS grade (Optima, Thermo). Mass spectrometer (AscendMultiOmics, Thermo) operated in High/High mode is calibrated weekly. Samples are analyzed by Data Dependent Acquisition (DDA) in positive (+3.5 kV) and negative (-2.5 kV) polarity*, separate runs. ESI gas parameters: sheath gas, 50 AU; auxiliary gas, 10 AU; sweep gas, 1 AU. Ion-transfer tube, and probe heater temperature, 325 °C and 350 °C, respectively. Orbitrap MS1: resolution, 60,000; AGC target, 400,000 (‘Standard’); maximum injection time, 123 ms; mass ranges, 250-1500 Th. Orbitrap MS2: resolution, 15,000, AGC target, 50,000, 50 ms injection time, a 1.5 Th isolation window, stepped normalized collision energies of 25, 30, and 35 units, and a 1 sec cycle time.
Typically 2 µL sample, maintained at 4°C, is injected by a UHPLC system (Vanquish Duo, Thermo) and separated by reversed phase chromatography (Ascentis Express 90 Å C18, 2.7 μm, 15 cm × 4.6 mm, Thermo). The column is heated to 55 °C and the gradient, composed of mobile phase A (10 mM ammonium formate in 60:40 water:acetonitrile in 0.1% formic acid) and mobile phase B (10 mM ammonium formate in 88:10:2 isopropanol:acetonitrile:water in 0.1% formic acid), is delivered at 260 µl/min. All solvents are LCMS grade (Optima, Thermo). Mass spectrometer (AscendMultiOmics, Thermo) operated in High/High mode is calibrated weekly. Samples are analyzed by Data Dependent Acquisition (DDA) in positive (+3.5 kV) and negative (-2.5 kV) polarity*, separate runs. ESI gas parameters: sheath gas, 50 AU; auxiliary gas, 10 AU; sweep gas, 1 AU. Ion-transfer tube, and probe heater temperature, 325 °C and 350 °C, respectively. Orbitrap MS1: resolution, 60,000; AGC target, 400,000 (‘Standard’); maximum injection time, 123 ms; mass ranges, 250-1500 Th. Orbitrap MS2: resolution, 15,000, AGC target, 50,000, 50 ms injection time, a 1.5 Th isolation window, stepped normalized collision energies of 25, 30, and 35 units, and a 1 sec cycle time.
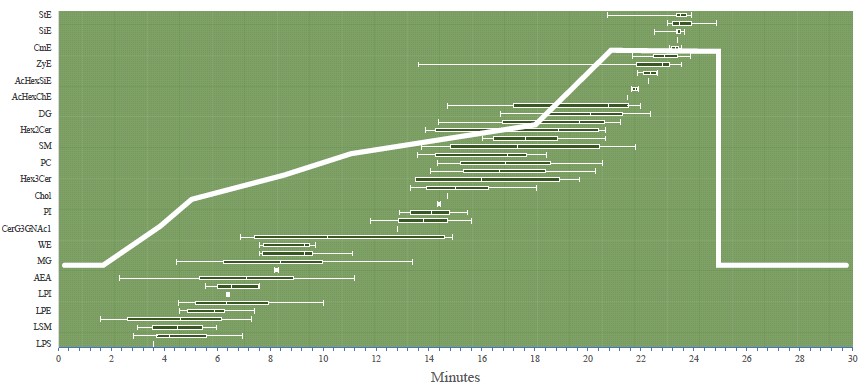
Typical reversed phase gradient for the analysis of lipids. Retention Time windows of selected lipid classes are marked: 0m: 32%B -> 1.5m: 32%B -> 4m: 45%B -> 5m: 52%B -> 8m: 58%B -> 11m: 66%B -> 14m: 70%B -> 18m: 75%B -> 21m: 97%B -> 25m: 97%B -> 25.1m: 32%B -> 30m: 32%B
Data Query
DDA based lipid analysis is processed using LipidSearch v.5.2.7. Precursor and fragment ion mass search accuracies are set to 5 ppm and 10 ppm, respectively. Relative fragment ion threshold is set to 1.0. For the chromatographic separation, a Merge RT tolerance and RT Correlation are set to 0.5 and 3.0, respectively. Merge Intensity Ratio threshold and Merge Valid Count ratio threshold are set to 5.0 and 0.5, respectively.
DDA based lipid analysis is processed using LipidSearch v.5.2.7. Precursor and fragment ion mass search accuracies are set to 5 ppm and 10 ppm, respectively. Relative fragment ion threshold is set to 1.0. For the chromatographic separation, a Merge RT tolerance and RT Correlation are set to 0.5 and 3.0, respectively. Merge Intensity Ratio threshold and Merge Valid Count ratio threshold are set to 5.0 and 0.5, respectively.
Data Analysis
LipidSearch ‘raw’ data are processed as follows: Lipid Match Grade, CV, R square and Background is accessed and calculated based on pool samples (n>3). Lipids fulfilling set thresholds are normalized using a deuterated ISTD similar to described by Koelmel et al. In short: endogenous lipid signals are normalized to the signal of the deuterated standard that is most similar in structure and closest in retention time. If no ISTD components are relevant, the endogenous lipid is normalized to the median ISTD signal. An in-house R-script is used for the processing/normalization.
LipidSearch ‘raw’ data are processed as follows: Lipid Match Grade, CV, R square and Background is accessed and calculated based on pool samples (n>3). Lipids fulfilling set thresholds are normalized using a deuterated ISTD similar to described by Koelmel et al. In short: endogenous lipid signals are normalized to the signal of the deuterated standard that is most similar in structure and closest in retention time. If no ISTD components are relevant, the endogenous lipid is normalized to the median ISTD signal. An in-house R-script is used for the processing/normalization.
Results
Results are shared via email. Larger files are shared via DropBox. The results are typically presented in an Excel report with multiple tabs. Important tabs includes: ‘Class_Summary_Normalized’, ‘Datatable_Normalized’, ‘Class_Summary_Raw’ and ‘Datatable_Raw’. Explanation of typical Excel Report format and an example Excel Report are available: How to read an untargeted lipid report & Example Report.
Results are shared via email. Larger files are shared via DropBox. The results are typically presented in an Excel report with multiple tabs. Important tabs includes: ‘Class_Summary_Normalized’, ‘Datatable_Normalized’, ‘Class_Summary_Raw’ and ‘Datatable_Raw’. Explanation of typical Excel Report format and an example Excel Report are available: How to read an untargeted lipid report & Example Report.
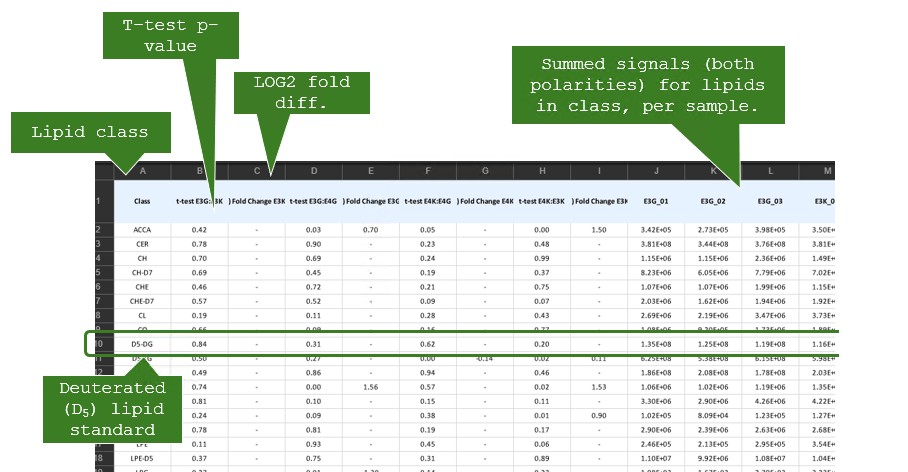
How to read a untargeted lipid analysis report.
Expectations and Limitations
A typical untargeted lipid analysis, after quality control filtering, covers ~1,000 lipids.
Fragmentation is limited for certain lipids which can make their identification difficult when using standard fragmentation techniques (HCD/CID).
Some lipids, exemplified by cholesterol are not easily charged using electrospray ionization (ESI) which can decreases sensitivity.
LipidSearch contains a large set of lipids, but not all lipids are included. To match a lipid, the lipid must, as a minimum, be defined in the search algorithm database.
–
*) For larger sample sets: A library is generated by analyzing pool sample(s) using DDA, separate injections using positive and negative polarity. Samples are analyzed using polarity-switch MS1-only and measured MS1 masses are compared to the library generated from the pool(s).