Experimental - Lipid Analysis
A lipid analysis at the PRC is composed of 4 steps: sample preparation, LC-MS/MS acquisition, data query and data analysis .
Sample Preparation
Lipid samples are typically extracted using 2-phase or a Wessel-Flügge extraction. Extracted analysts are dried and reconstituted in 40uL 65:30:5 (isopropanol:acetonitril:water) (Thermo, Optima) containing 1:100 (v/v) of UltimateSPLASH™ ONE. Following vortex and centrifugation (~12k RPM/~18k RCF). 35uL of each sample is transferred to HPLC glass vials (Waters, p/n 186000385c) and the remaining 5uL is used to generate a pool sample. Prior to analysis by LC-MS/MS order of injections are randomized.
LC-MS/MS
Samples are separated
Vanquish
UHPLC System (Thermo Fisher Scientific). The instruments were externally calibrated weekly
using Calibration Solution (Thermo Fisher Scientific). For chromatographic separation, samples
were loaded on a Ascentis Express 90 Å C18 (2.7 μm) HPLC column (15 cm × 4.6 mm) at 55 °C
and eluted with a solvent system composed of mobile phase A (10 mM ammonium formate in
60:40 water:acetonitrile + 0.1% formic acid) and mobile phase B (10 mM ammonium formate in
88:10:2 isopropanol:acetonitrile:water + 0.1% formic acid). The injection volume was set to 2 µl,
and samples were maintained at 4 °C. The gradient (vol/vol) used was as follows: 0–1.5 min, held
at 32% B; 1.5–4 min linear gradient from 32% to 45% B; 4–5 min linear gradient from 45% to
52% B; 5–8 min linear gradient from 52% to 58% B; 8–11 min linear gradient from 58% to 66%
B; 11–14 min linear gradient from 66% to 70% B; 14–18 min linear gradient from 70% to 75% B;
18–21 min linear gradient from 75% to 97% B; 21–25 min, held at 97% B; 25–25.1 min, returned
to 32% B; 25.1–30 min, equilibrated at 32% B at a flow rate of 260 µl/min.
Mass spectrometry was operated in positive (POS) and negative (NEG) polarity mode separately
during acquisition with the following source conditions: spray voltage, +3.5 kV and -2.5 kV; sheath
gas, 50 AU; auxiliary gas, 10 AU; sweep gas, 1 AU; ion-transfer tube temperature, and probe
heater temperature, 325 °C and 350 °C, respectively. Samples were analyzed with the following
acquisition parameters. MS1 scans: resolution, 60,000; AGC target, 4 × 10⁵
(Standard); maximum
injection time, 123 ms; mass ranges, 250-1500 Th. The HCD-based data-dependent acquisition
(DDA) was applied to samples for untargeted analysis with the following parameters: a resolution
of 15,000, AGC target, 5 × 10⁴
, 50 ms injection time, a 1.5 Th isolation window, stepped
normalized collision energies of 25, 30, and 35 units, and a 1 sec cycle time
UHPLC System (Thermo Fisher Scientific). The instruments were externally calibrated weekly
using Calibration Solution (Thermo Fisher Scientific). For chromatographic separation, samples
were loaded on a Ascentis Express 90 Å C18 (2.7 μm) HPLC column (15 cm × 4.6 mm) at 55 °C
and eluted with a solvent system composed of mobile phase A (10 mM ammonium formate in
60:40 water:acetonitrile + 0.1% formic acid) and mobile phase B (10 mM ammonium formate in
88:10:2 isopropanol:acetonitrile:water + 0.1% formic acid). The injection volume was set to 2 µl,
and samples were maintained at 4 °C. The gradient (vol/vol) used was as follows: 0–1.5 min, held
at 32% B; 1.5–4 min linear gradient from 32% to 45% B; 4–5 min linear gradient from 45% to
52% B; 5–8 min linear gradient from 52% to 58% B; 8–11 min linear gradient from 58% to 66%
B; 11–14 min linear gradient from 66% to 70% B; 14–18 min linear gradient from 70% to 75% B;
18–21 min linear gradient from 75% to 97% B; 21–25 min, held at 97% B; 25–25.1 min, returned
to 32% B; 25.1–30 min, equilibrated at 32% B at a flow rate of 260 µl/min.
Mass spectrometry was operated in positive (POS) and negative (NEG) polarity mode separately
during acquisition with the following source conditions: spray voltage, +3.5 kV and -2.5 kV; sheath
gas, 50 AU; auxiliary gas, 10 AU; sweep gas, 1 AU; ion-transfer tube temperature, and probe
heater temperature, 325 °C and 350 °C, respectively. Samples were analyzed with the following
acquisition parameters. MS1 scans: resolution, 60,000; AGC target, 4 × 10⁵
(Standard); maximum
injection time, 123 ms; mass ranges, 250-1500 Th. The HCD-based data-dependent acquisition
(DDA) was applied to samples for untargeted analysis with the following parameters: a resolution
of 15,000, AGC target, 5 × 10⁴
, 50 ms injection time, a 1.5 Th isolation window, stepped
normalized collision energies of 25, 30, and 35 units, and a 1 sec cycle time
——
Orbitrap Ascend Method Summary
Creator: ASCENDMULTI1\Thermo Scientific Last Modified: 12/17/2025 14:23:58 by ASCENDMULTI1\Thermo Scientific
Global Settings
Use Ion Source Settings from Tune = Not Checked
Method Duration (min) = 30
Collision Gas pressure (mTorr) = 1
Ion Source Type = H-ESI
Spray Voltage = Static
Spray Voltage: Positive Ion (V) = 3500
Spray Voltage: Negative Ion (V) = 2500
Gas Mode = Static
Sheath Gas (Arb) = 50
Infusion Mode (LC) = Liquid Chromatography
Aux Gas (Arb) = 10
Sweep Gas (Arb) = 1
Ion Transfer Tube Temp (°C) = 325
Vaporizer Temp (°C) = 350
APPI Lamp = Not in use
Total Carrier Gas Flow Type = Static
FAIMS Mode = Not Installed
Application Mode = Small Molecule
Pressure Mode = Standard
Default Charge State = 1
Advanced Peak Determination = False
Xcalibur AcquireX enabled for method modifications = False
Mild Trapping = False
Experiment 1
Experiment Name = MS
Start Time (min) = 0
End Time (min) = 30
Cycle Time (sec) = 1
Scan MasterScan
MSn Level = 1
Desired minimum points across the peak = 6
Use Wide Quad Isolation = True
Detector Type = Orbitrap
Orbitrap Resolution = 60K
Mass Range = Normal
Scan Range (m/z) = 250-1500
Maximum Injection Time (ms) = 123
Absolute AGC Target = 400000
Normalized AGC Target (%) = 100
Microscans = 1
RF Lens (%) = 40
Maximum Injection Time Mode = Custom
Use ETD Internal Calibration = False
Data Type = Profile
Polarity = Positive
Source Fragmentation = False
Scan Description =
Enhanced Resolution Mode = Off
Filter IntensityThreshold
Intensity Filter Type = Intensity Threshold
Minimum Intensity = 50000
Maximum Intensity = 1E+20
Relative Intensity Threshold (%) = 0
Filter DynamicExclusion
Use Common Settings = False
Exclude after n times = 1
Exclusion duration (s) = 5
Mass Tolerance = ppm
Mass tolerance low = 10
Mass tolerance high = 10
Exclude isotopes = True
Perform dependent scan on single charge state per precursor only = False
Exclude Within Cycle = True
Data Dependent Properties
Data Dependent Mode = Cycle Time
Scan Event 1
Scan ddMSnScan
Desired minimum points across the peak = 6
HCD Collision Energy Type = Normalized
MSn Level = 2
Isolation Mode = Quadrupole
Enable Intelligent Product Acquisition for MS2 Isolation = False
Isolation Window (m/z) = 1.5
Isolation Offset = Off
Reported Mass = Original Mass
Multi-notch Isolation = False
Scan Range Mode = Define First Mass
First Mass (m/z) = 75
Scan Priority= 1
ActivationType = HCD
Assisted = False
HCD Collision Energy/Energies (%) = 25,30,35
Detector Type = Orbitrap
Orbitrap Resolution = 15K
Maximum Injection Time (ms) = 50
Absolute AGC Target = 50000
Inject ions for all available parallelizable time = False
Normalized AGC Target (%) = 100
Microscans = 1
Maximum Injection Time Mode = Custom
Use ETD Internal Calibration = False
Data Type = Profile
Polarity = Positive
Source Fragmentation = False
Scan Description =
Time Mode = Unscheduled
Enhanced Resolution Mode = Off
——
Q-Exactive Plus or an Ascend MultiOmics (Thermo) is used Each sample is analyzed MS/MS, column, gradient , solvents
Pool samples are injected per 6-12 samples. When feasible, minimum 4 pool samples are analyzed per submission.
Data query :
Lipid-Search version (settings). This software is considered a leading software for analysis of DDA lipid experiments
Data analysis
Filtering for CV that include pools
Using heavy standards (link to paper)
Median normalization
RT validation…(to come)
Limitations
Fragmentation information of some lipids is sparse. Some adducts are not considered in the search engine.
Some lipids undergo insure decay.
All of the above can results in false positives and missed lipids
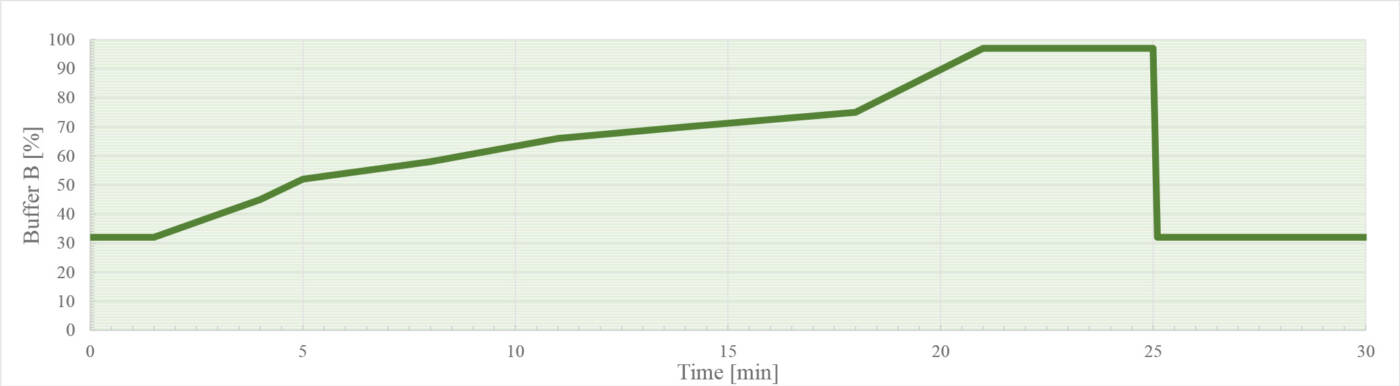
Typical reversed phase gradient for analysis of lipids.